
Here are some immediate things to think about regarding COVID-19 and its impact on ecommerce and ecommerce conversion rates in cities that have 'shelter in place' rules versus those that don't.
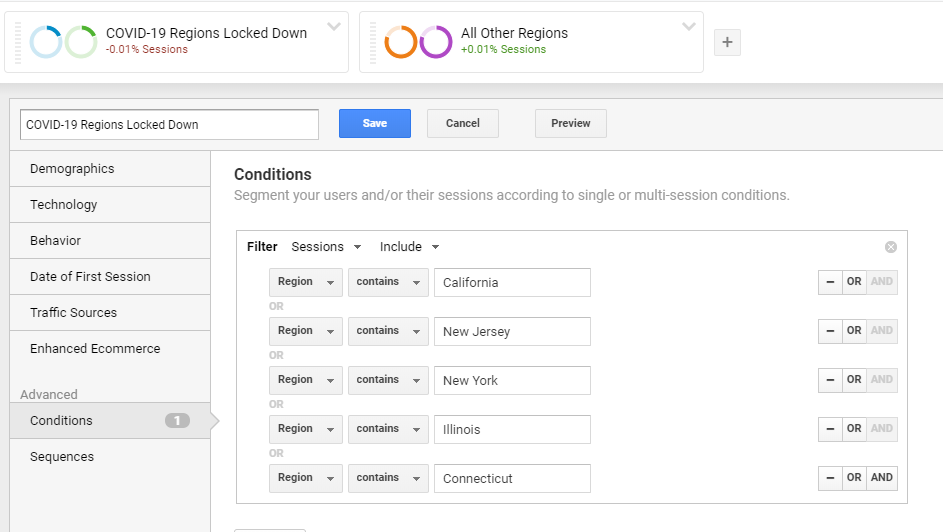
- Right now, you should build segments in Google Analytics to show the difference in performance of shelter in place states versus all others. At the time of this article's publishing, the shelter in place states are California, New York, New Jersey, Illinois and Connecticut.
- Review the ecommerce conversion rate and all other performance metrics of those cities and states impacted the most by COVID-19 so far.
- Is your paid, email, organic or direct channel performance down in those hard-hit COVID-19 areas? By how much? If it's significant, you should consider bidding down in those geographic areas and adjusting your paid (and other channels) strategy accordingly.
- Are your average order value and ecommerce rates up for shelter in place regions (perhaps you sell toilet paper)? In that case, you need to double down in those regions.
The point is to immediately create two cohorts and analyze your ecommerce data accordingly:
- Cohort A: Region = CA, NY, IL, NJ or CT
- Cohort B: Country = US and Region is not CA, NY, IL, NJ or CT
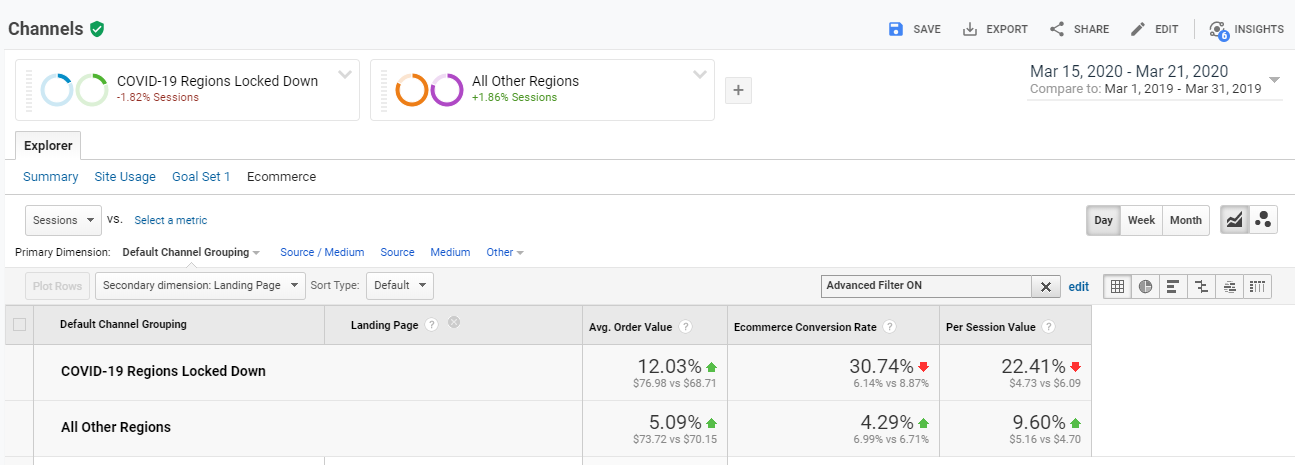
Shown below is the average order value (AOV), ecommerce conversion rate and per session value of the COVID-19 shelter in place states versus all other states for the week of March 15, 2020 compared to the same dates in March 2019:

Here's what we're seeing:
- For the rest of the U.S., our ecommerce conversion rate for this specific client was up 4.3%. But for the COVID-19 stay at home states, it's down 31%.
- Per session value is also down -22% for the COVID-19 cohort versus a +10% increase for all other states.
- Interestingly, average order value (AOV) is up 12% for the COVID-19 cohort. The assumption is that those who are still ordering in the COVID-19 cohort are "stocking up" compared to the other cohort. But this does not make up enough revenue to displace the big drop in conversion rates.
Different verticals are experiencing drastically different performance metrics, as we've already seen across the internet. The client shown above (in the apparel industry) is clearly an example of a business that's being negatively impacted by COVID-19.
The key takeaway? Go deeper and start adjusting your marketing strategy immediately based on geography. You'll likely notice a big shift in states and cities that previously performed well. Adjust accordingly, stay ahead and spend your marketing money wisely!
For more help with ecommerce digital marketing, reach out to Human today.