

Consistently measuring your marketing funnel is essential for hitting profit goals, staying competitive and growing your business. Ecommerce funnel metrics indicate whether you’re nailing your goals or falling short with room for improvement.
Ecommerce business leaders should monitor their data to inform marketing and sales decisions and retain a steady path toward success. But how do you determine the most important metrics to track?
Let’s take a look at the best KPIs for measuring the performance of an ecommerce business at every stage of the funnel:
Tracking Ecommerce Funnel Metrics
The sheer amount of data and analytics tools available can quickly become overwhelming if you don’t have some core sales funnel KPIs in place.
Start by setting up your ecommerce business on an analytics platform, if you haven’t done so already. Google Analytics is a free tool that tracks most of the ecommerce metrics we’ll discuss in this post.
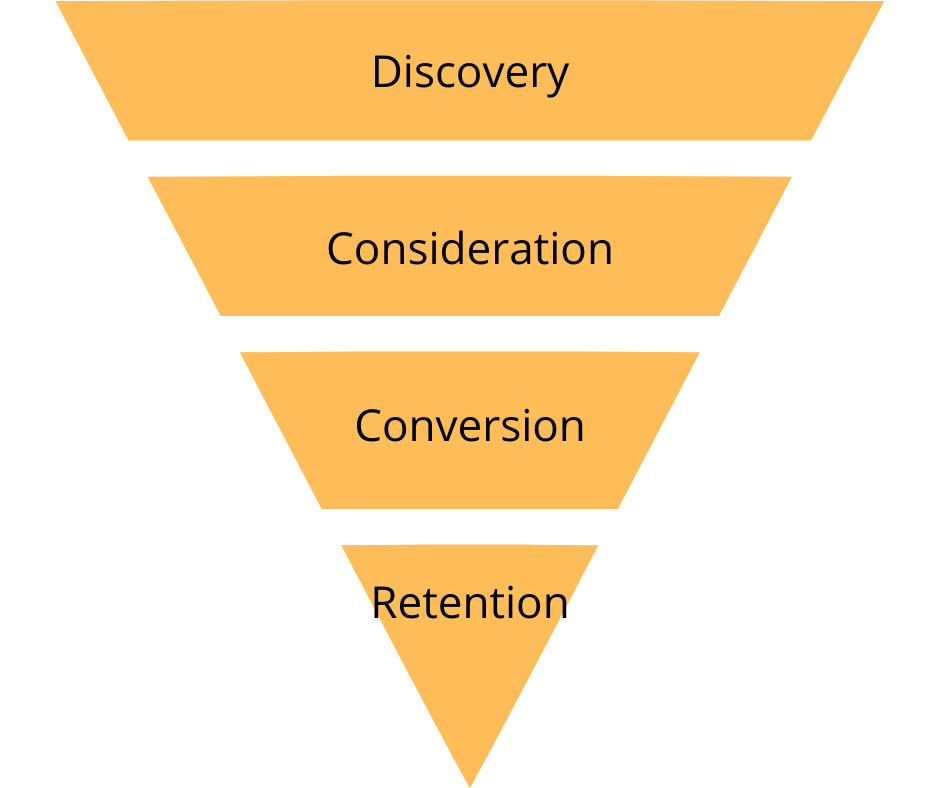
Now, let’s talk about how to track the top KPIs for ecommerce at every stage of the marketing funnel: discovery, consideration, conversion and retention.
Discovery KPIs
At this stage of the funnel, you should focus your marketing efforts on generating brand awareness and building demand for your product.
Users in the discovery stage are just learning about your brand and what you’re all about. You’ll want to focus on KPIs that disclose where your new visitors are coming from, how often they’re coming to your site and whether they’re willing to engage with your content.
Your top KPIs should include:
1. Traffic Sources and Mediums
Analytics Help defines ‘source’ as “the origin of your traffic, such as a search engine (for example, Google) or a domain (example.com).”
The ‘medium’ indicates the “category of the source, for example, organic search (organic) [or] cost-per-click paid search (CPC).”
Now that Google has announced it’s gradual shutdown of Universal Analytics in favor of GA4, you’ll need to adjust your approach slightly in order to find this information. While normally you’d find this report under Acquisition > All Traffic > Source/Medium, in GA4 you’ll need to create a custom report.
Understanding how users find and engage with your site is an excellent step to tailoring your customer experience and to nudge users to the next stage of the funnel.
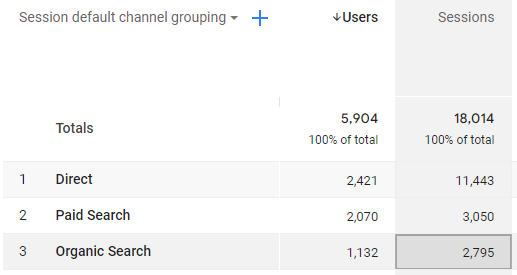
2. Organic Traffic Sessions
If you rely heavily on inbound traffic from blogs and keyword tactics through SEO, this metric will show how many visitors are finding you from search engines. It’s always wise to track organic traffic sessions – they’re a clear indicator of your website’s search engine performance, credibility and authority.
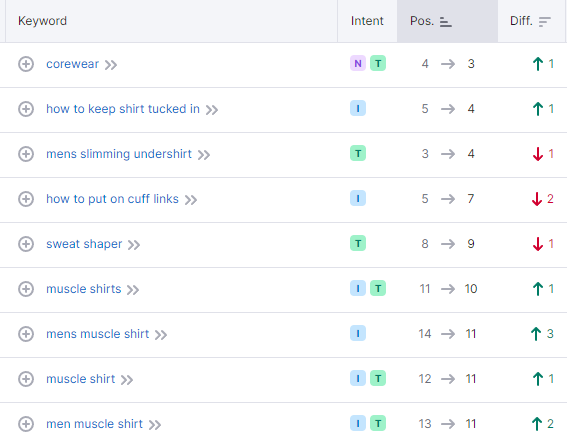
3. SEO Keyword Positions
Use a tool like Moz or SEMrush to track important keyword positions over time. You’ll want to increase rankings (or maintain top rankings) for your biggest target keywords. Higher rankings = more visibility, more qualified buyers and more revenue.
See how Human can help you grow your organic traffic through content marketing.
4. Ad Impressions
If you’re running any ads on Facebook, Instagram or Google AdWords, you’ll want to track the number of impressions, which is how many times all users see your ad.
In many cases, the first experience a person has with a brand is through an impression. Following that impression, they may move forward along the customer journey or decide they need more information or an incentive to change their mind.
5. Ad Frequency
Ad frequency shows how many times someone has seen your ad. Keep in mind that high ad frequency can indicate audience fatigue, so be sure to test a variety of creatives.
Curious about Facebook marketing? Learn how to create successful Facebook retargeting ads.
Consideration KPIs
In the consideration stage, you want to get potential and existing customers to engage with your brand. The most important funnel metrics in this stage relate to inbound traffic, email and social media engagement.
We’ll begin with onsite traffic metrics, which are good indicators of your site’s quality and performance. Google Analytics 4 makes it easy to track these important metrics from your custom reports.
6. Sessions
Sessions indicate the number of visits to your site. All the interactions a visitor has on your website within a given timeframe (30 minutes) will register as a single session.
7. Engagement Rate
GA4 has replaced Bounce Rate and Average Session Duration with Engagement Rate. This shift aligns with the goal to be more event and action-oriented than Universal Analytics. Instead of showing you metrics that describe inactivity, it now tells you how many engaged sessions your site recieves. These are sessions that:
- Last longer than 10 seconds
- Contain more than one pageview
- Contain at least one conversion event
This metric is an even better representation of visitors who are actively thinking about your product or service, making it a valuable metric for consideration.
8. Pages Per Session
A higher number of pages per session says that users find your content engaging and are willing to explore more of your site. A good goal for this KPI is two pages per session.
In GA4, you’ll be able to create groups of users who meet the goal of two pages per session in order to seamlessly track this metric.
9. Click-through Rate
Tracking CTR helps you understand your campaigns’ success. When someone takes the next step to fill out a form or provide their email address, it’s a sign that your content or offer is compelling and relevant.
You can calculate CTR (which is expressed as a percentage) with the following equation:
CTR = (Number of clicks ÷ Number of impressions) x 100
Let’s dive into email engagement metrics next.
Email Engagement Metrics
10. Email List Growth Rate
Your list should be growing consistently. If you’re emailing offers to a stale list of contacts, your messages are falling on deaf ears. If your subscriber list isn’t growing, you’ll want to explore ways to expand your audience.
Formula: (Total number of new subscribers – unsubscribers) ÷ Total number of email addresses on your list
11. Email Open Rate
This is the percentage of recipients who open your email. A low or declining open rate could be a sign that your subject lines aren’t engaging enough.
Formula: Unique open emails ÷ (Total number of emails sent – total number of bounced emails)
12. Email Click-through Rate (CTR)
This is the percentage of recipients who click on links in your emails. A higher click-through rate signifies interest in your product or content and increases the chance of a conversion.
Formula: (Total clicks OR unique clicks ÷ number of delivered emails) x 100)
13. Email Conversion Rate
This is the percentage of email recipients that purchase after clicking through links in your email campaigns.
Formula: (Total sales from emails ÷ total emails delivered) x 10)
14. Email Unsubscribes
Keeping track of your unsubscribe rate is helpful for calculating list growth rate. If you notice a staggering increase in unsubscribes, you might want to reevaluate your email marketing strategy to create better content that appeals to your database.
Pro-tip: Unsubscribes are inevitable for any list, so don’t fret over a lost contact. In fact, unsubscribes improve the quality of your list, allowing you to focus on contacts who actually want to hear from you.
Looking to improve your email strategy? Learn more about our email marketing services.
Next, let’s review the top social media metrics to track for your ecommerce business.
Social Media Metrics
15. Engagement Rate
Depending on the social platforms you’re using, there are few ways to assess overall social engagement. Engagement can come in the form of likes, comments, shares, saves, clicks or profile visits, to name a few.
Higher engagement activity shows that your social audience finds your content entertaining or helpful.
16. Impressions
Is your social media content getting visibility? Post impressions indicate how many times your content shows up on a social platform.
To increase impressions in 2022, it’s important to post on social media regularly and consistently (whatever that frequency may be), and explore other mediums, such as Instagram Reels or TikTok videos, to reach new people.
17. Clicks
This metric measures link click-throughs from social posts or profiles. A higher number of clicks means that users are interested in your content and want to learn more. When you post on social media, make it easy for followers to click through your call-to-action.
18. Followers
Some marketers consider followers to be a vanity metric, but it’s still important to track and keep an eye on.
Follower growth indicates you’re capturing the interest of more prospects, and it also helps with overall social reputation. For best practice, compare your follower growth to your engagement rate to get a true understanding of how well your social media content is performing.
Conversion KPIs
Tracking online sales and revenue is vital for any ecommerce business. Understanding the following metrics will help you uncover sales trends and tweak strategies to convert more visitors into buyers.
Important ecommerce conversion KPIs include:
19. Cost of Customer Acquisition (CoCA)
CoCA (sometimes written as customer acquisition cost - CAC) helps you calculate the value of your digital marketing efforts. To determine CoCA, add together all marketing costs, services, software and overhead, and divide by the number of customers acquired.
Formula: (Marketing Costs + Services + Software + Overhead) ÷ Number of Customers Acquired
20. Return on Ad Spend (ROAS)
Which ad campaigns genuinely provide value for your business? By understanding ROAS, you can determine how to allocate your ad dollars best. The calculation is simple: revenue divided by cost.
Formula: ROAS = Revenue ÷ Cost
21. Number of Online Transactions
Tracking total transactions is an important baseline metric for calculating other sales KPIs. Be sure to monitor these month-over-month, quarter-over-quarter and year-over-year. And, track the success of discounts and promotions to gauge performance relative to regular sale days.
22. Average Order Value (AOV)
Monitoring your AOV can help you influence sales trends and boost revenue over time. To increase average order value, consider selling bundles or implementing an upsell widget to promote other relevant products to customers who are about to check out.
Formula: Total sales ÷ Number of transactions
23. Cart Abandonment Rate
Look to your ecommerce platform for this information. To reduce cart abandonment rates, many ecommerce retailers send abandoned cart emails or use remarketing ads to re-engage interest.
24. Ecommerce Conversion Rate
Your conversion rate is the percentage of visitors that convert into buyers. The average ecommerce website conversion rate is 2 to 3%.
Formula: Total number of sales ÷ total number of sessions
Learn how to improve your ecommerce product pages to convert.
25. Sales Generated by Channel
Review this metric to understand which channels are worth the investment, and which channels you might want to scale back on.
Retention KPIs
Repeat business is a crucial factor in growing and scaling your ecommerce business. Increasing customer retention rates by just five percent can lead to a profit increase of 25 to 95 percent. In the long run, it’s cheaper to retain existing customers (and build their loyalty) rather than acquire new ones.
Here are three ecommerce retention KPIs you should have on your radar:
26. Average Customer Lifetime Value (CLV)
Your CLV is a cornerstone ecommerce KPI. It is the average total amount spent by each customer over their lifetime. Your CLV should always be greater than your cost per customer acquisition.
Formula: Average order value x Purchase frequency
27. Repeat Purchase Rate
This is the proportion of repeat customers from your overall customer base. Repeat customers are happy customers that increase your business’ profitability, so keep a close watch on this metric.
Formula: Total customers that have purchased more than once ÷ Total number of customers
28. Order Gap Analysis
This metric shows the average time between two purchases from a single customer. This insight is helpful for marketing automation efforts. You can automatically remind customers to repurchase after the average time between transactions.
Formula: 365 ÷ Purchase frequency metric = Average number of days between purchases
29. Return on Investment (ROI)
ROI matters. It’s what CEOs and shareholders want to hear about, and it clearly shows what marketing efforts are working (or not working).
The basic formula for ROI is simple: Net profit ÷ total investment (expressed as a percentage). However, keep in mind that the complexity of your ROI formula can vary depending on how your business operates.
Formula: ROI = Net profit ÷ total investment
Grow and Scale Your Ecommerce Business with Human
These ecommerce funnel metrics will help you sharpen your ecommerce marketing efforts. But knowing how to analyze these metrics together and extract real business takeaways is key.
At Human, we understand that all successful marketing strategies are rooted in real data. We’re passionate about tracking KPIs that matter and helping ecommerce businesses turn soft metrics into real ROI. With our help, you can take your ecommerce business to the next level and see leads and results for years to come.
Ready to start leveraging ecommerce KPIs to refine your marketing strategy and convert more customers? Let’s chat.